It creates an image file called output in the folder/directory your .py file is run from.
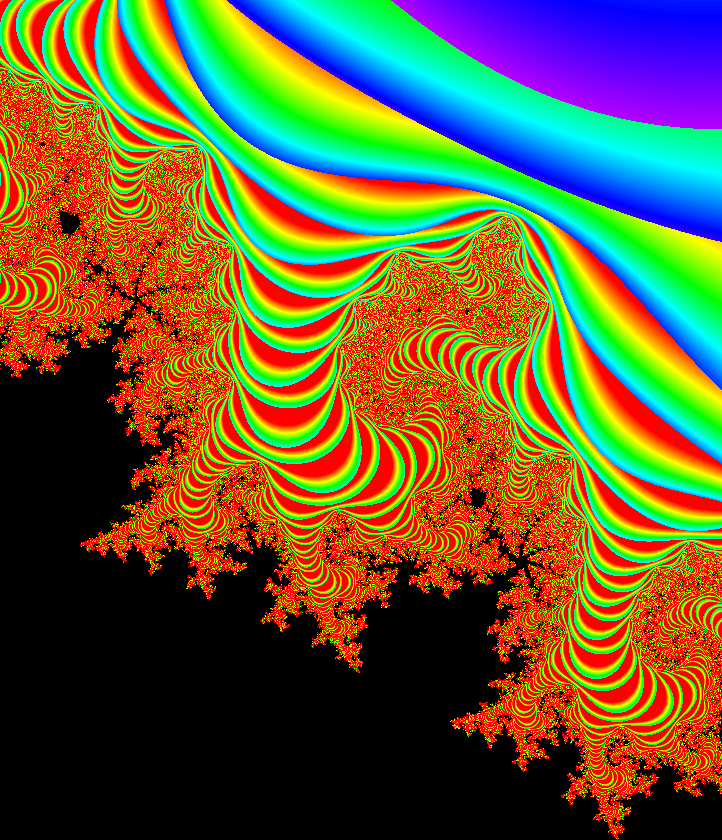
Super fun! Here's a tweak I made for the Julia set.
from math import floor, ceil, sin,cos
def linear_interpolation(color1, color2, t):
return color1 * (1-sin(t)) + (color2 * cos(t))
# Image size (pixels)
WIDTH = 1000
HEIGHT = 1000
# Plot window
RE_START = -0.60
RE_END = -0.00
IM_START = -0.20
IM_END = 0.40
c = complex(-0.8, 0.156)
It works on the Mandelbrot set too... very Lovecraft meets Alice in Wonderland!
I love how a 3D structure of roots, reaching into infinity, seems to appear with this color scheme.
from math import floor, ceil, sin, cos
def linear_interpolation(color1, color2, t):
return color1 * (1-sin(t)) + (color2 * cos(t))
# Image size (pixels)
WIDTH = 1000
HEIGHT = 1000
# Plot window
RE_START = -0.925
RE_END = -0.800
IM_START = -0.325
IM_END = -0.200
Hello, I have a question. At the beginning of the definition, you assume that the sequence is not bounded if the modulus of one of its terms is greater than 2. I can't figure out a demonstration for that fact. Could you help me or give me advice ?
Thanks a lot
One suggestion for extending the tool: Add a constant called NODES = 1, and replace "x=x*x+c" with "x=x^(NODES+1)+c".
This is because the standard Mandlebrot set is based on "X^2+C", but incrementing that exponent to X^n gives you n-1 nodes as the result. I replicated this by just adding more x's to the code above, but since most people don't know that property of the set, it would be an easy way for them to play with it.
Proper notation to get this to work in Python 3.7 is "x=x**(NODES+1)+c" ** is the notation for exponent in python.
Thanks! I was struggling to understand The Mandelbrot Set, but now it's all clear.
I am not a programmer, but I am trying to get this code to work, the interpreter returned this line a syntax error,
color = 255 - int(m * 255 / MAX_ITER)
Im running Python 3.8.2, thank you in advance to anyone for their assistance. Nick
Ps, I'm working my way through this. The above issue has been solved; now on to the next issue! :)
I got this error:
from mandelbrot import mandelbrot, MAX_ITER
ModuleNotFoundError: No module named 'mandelbrot'
I use Google Colab.
Thanks,
Please note, that there are sources for two .py files plot.py and mandelbrot.py (see the tabs in the source code window). You should store both into the same folder/project.
why does it not work in python 3.8
When I run your first 2 examples, the smoothed mandelbrot does not look any different.
In the max_iter program it seems like you're going from -1 to 1. In the bw plot.py it seems like the real part RE_START, RE_END goes from -2 to 1 but the imagineary part IM_START, IM_END goes from -1 to 1. I was under the impression that the Mandelbrot set lies in the coordinate space of -1 to 1. Is that true?, if so why does the real part go from -2 to 1?
EDIT* Never mind, It works great with python3.
When I copy the two files plot.py and mandelbrot.py to my local computer I get an all white image for the black and white code and and all red image for the color code. I have pil installed. Am I missing something?
Is it ok if I don't understand this in the 8th grade?
That's perfectly ok, you need to learn what's a coordinate system, a sequence and what is a complex number. Feel free to ask questions!
It got executed perfectly. Too bad it literally does nothing.